Basic tutorial: graphing analog sensor data
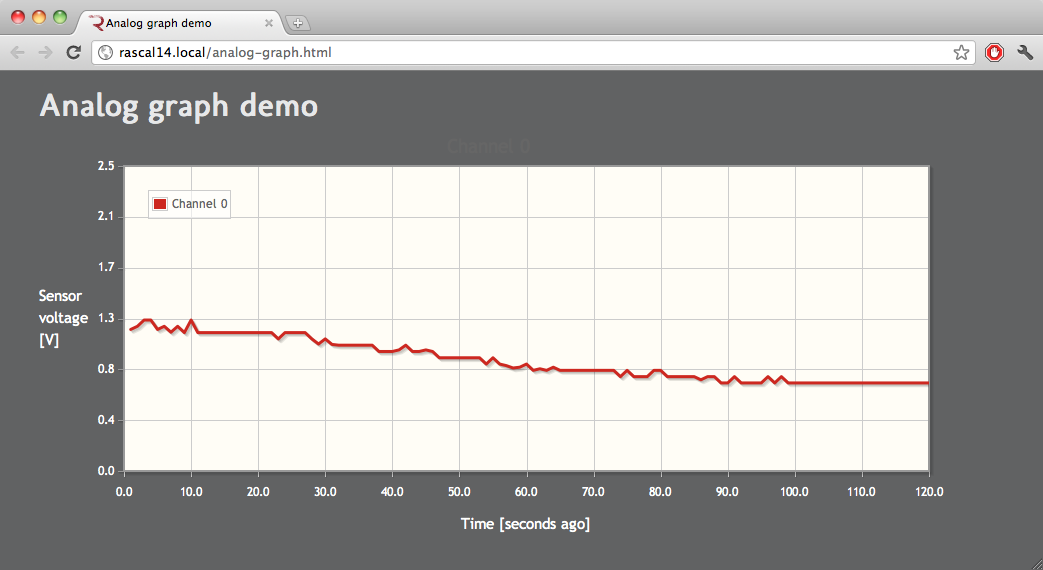
Let's say that you've got some sensor with an analog interface, i.e. it outputs a voltage proportional to what it's sensing, rather than a digital data stream. You want to look at a graph of that voltage in your web browser.
In this example, I'll use the Lilypad temperature sensor manufactured by Sparkfun.
Connect the pin labeled A/D ref to a voltage between ground and 3.3 V. This voltage determines the top end of the A/D converter's range. The bottom of the range is always ground. If your sensor voltage is above 3.3 V, you can scale it down to the 0-3.3 V range with a voltage divider. (Be careful about drawing too much current from your sensor, which will make the voltage sag.)
(More explanation of jQplot needed here.)
Here's the full HTML page.
<html>
<head>
    <meta charset="utf-8">
    <title>Analog graph demo</title>
    <link rel="stylesheet" type="text/css" href="http://fonts.googleapis.com/css?family=Droid+Sans|Molengo">
    <link rel="stylesheet" type="text/css" href="/static/demo.css">
    <link rel="shortcut icon" href="/static/favicon.ico">
    <script src="/static/jquery-1.5.js"></script>
    <!--[if IE]><script type="text/javascript" src="/excanvas.js"></script><![endif]-->
    <script type="text/javascript" src="/static/jquery.jqplot.js"></script>
    <link rel="stylesheet" type="text/css" href="/static/jquery.jqplot.css" />
</head>
<body>
    <div class="rascalcontent">
        <h1>Analog graph demo</h1>
        <div id="chart1" style="height:400px;width:900px;"></div>
    </div>
    <script type="text/javascript">
    chartOptions = {
        legend: {
            show: true,
            location: "nw" },
        title: "Channel 0",
        series: [
            {label: "Channel 0", lineWidth:3, showMarker:false}
        ],
        axes: {
            xaxis: {
                label: "Time [seconds ago]",
                min: 0,
                max: 120,
                pad: 0 },
            yaxis: {
                label: "Sensor voltage [V]",
                min: 0,
                max: 2.5 },
        },
        seriesColors: [ "#cd2820" ]
    };
    a0 = new Array();
    setInterval(function() {
        $.post("analog",  { adref: 2.5 }, function(response) {
            data = $.parseJSON(response);
            if(a0.length > chartOptions.axes.xaxis.max) {
                a0.pop();
            }
            a0.unshift(data.A0);
            $.jqplot("chart1", [a0], chartOptions).replot();
        });
    }, 200);
    </script>
</body>
</html>
Answering requests for sensor readings on the Rascal
When your browser requests a new reading by POSTing to /analog, we want the Rascal to read the A/D converter on the Rascal and return a value.
The four A/D converters on the Rascal have 10-bit resolution, which means that they output on a scale between 0 and 1023 because 1023 is the largest binary value you can write with 10 bits. (Here's a decent explanation of binary in the context of resolution if you're interested.)
(need more explanation of how this works here)
Here's the Python.
@public.route('/analog', methods=['POST'])
def analog():
    from pytronics import analogRead
    import json, time
    try:
        ad_ref = float(request.form['adref'])
    except KeyError:
        ad_ref = 3.3
    data = {
        "time" : float(time.time()),
        "A0" : float(analogRead('A0')) * ad_ref / 1024.0
    }
    return json.dumps(data)