Basic tutorial: DIY thermostat
This tutorial is halfway between a project report and a real tutorial. My original reason for designing the Rascal was to make hooking the thermostat in our house to the web easier. I was working an unpredictable schedule a couple winters ago, and I wanted our house to be warm when I got home, but not at the cost of heating it all day. I built a prototype using a small industrial computer. It was expensive, but it basically worked.
Now that I have the Rascal at my disposal, I want to make a badass thermostat. Here's what my thermostat should do:
- Pull target temperatures from recurring tasks on my Google calendar.
- Allow me to override the calendar with text messages.
- Show me a nice graph of temperature versus time in any modern web browser
- The obvious: sense the house temperature and switch our gas boiler on and off.
(In the long run, I'd also like the thermostat to log all the data and give me some useful summary statistics about energy usage, but this is supposed to be a basic tutorial. Back in your chairs!)
An overview of this crazy plan
Local Rascal zealot Mike Goelzer built an Arduino shield with two relays and a connector for a TMP102 temperature sensor. I'm using a TMP102 breakout board from Sparkfun that talks to the Rascal via I2C. Here's a diagram that shows how everything is hooked up.
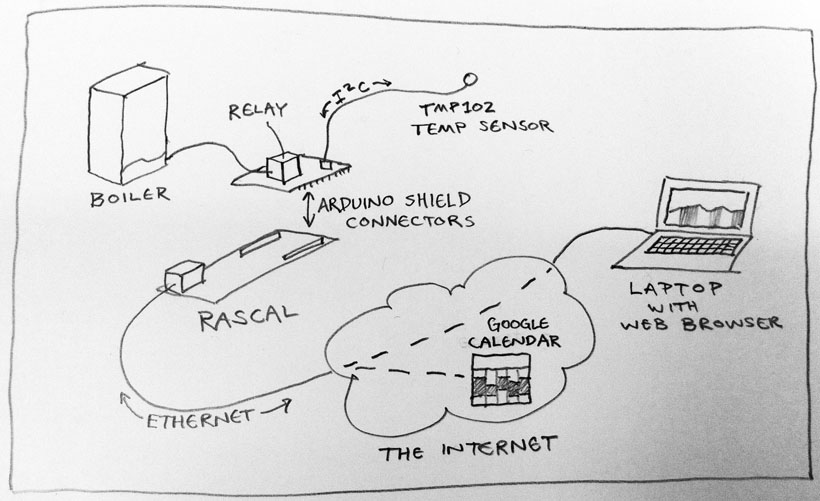
The Rascal will be in our basement, near the boiler and cable modem. The temperature sensor will be at the end of a cable snuck up through a gap in the floor into a hallway near the kitchen-- roughly the middle of our house, and not near any radiators or other heat sources.
Conceptually, the Rascal's relay will replace the old thermostat. When the relay is closed, the boiler pumps hot water through the radiators. When the relay opens, the boiler stops.
Initial testing
For testing, I set up a small power resistor as a tiny heater that I could use snugged up against the temperature sensor in a feedback loop.

Then I used the Rascal's I2C test page to check that the TMP102 sensor was wired up correctly and responding to data requests.
The temperature decision algorithm
("Ooh, an algorithm! This must be sophisticated!" Unfortunately, home heating just isn't that complicated, so the algorithm is pretty dull.)
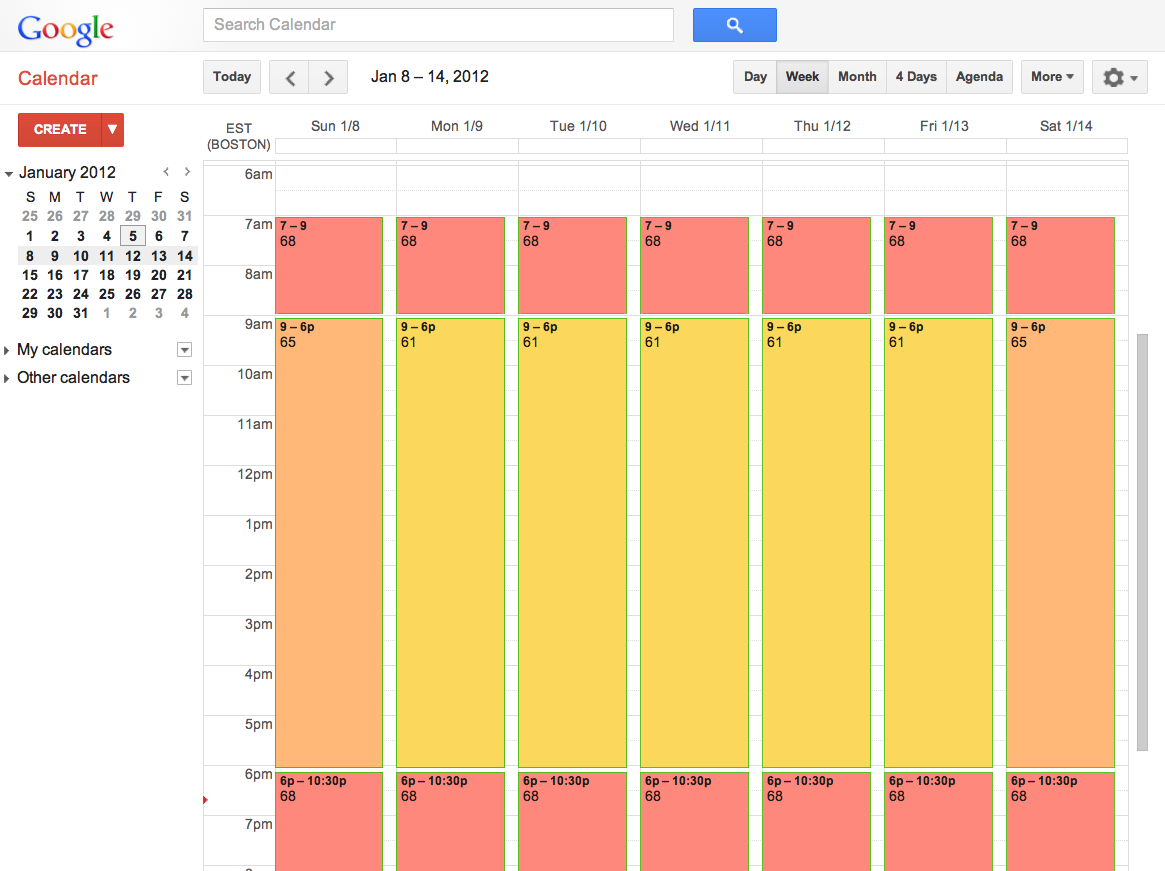
I have a public Google calendar filled with nothing but recurring thermostat events. You can see it live in a human readable form; there's also a screenshot of it further down.
Each event on the calendar has the summary field set to a temperature. In the background, the Rascal grabs a new copy of the calendar every 5 minutes. It stores a copy of the calendar so that if the Internet goes down, it has a record of what it should be doing. The Rascal also has default temperature set so that if everything goes crazy, it still won't let the house freeze.
Additionally, every time the calendar is checked, the Rascal also checks to see if I have texted a temperature to it. If so, it overrides the calendar.
The actual algorithm to decide whether to heat is boring: if the house is too cold, turn on the heat. Otherwise, don't. I ask the Rascal to update only every 3 seconds, so we don't have to worry about rattling back and forth across the threshold and forcing the boiler into some inefficient state where it is trying to start and stop at the same time.
The main loop
Let's start with the basic functionality-- checking the temperature and turning the heat on and off. I want the Rascal to query the temperature sensor over the I2C bus every few seconds.
The code below, added to server.py, does what we need. The line @rbtimer(3) at the beginning makes the Rascal's Python app server execute the function below every 3 seconds. (The "rb" comes from the fact that server implements the timer with red-black trees.)
@rbtimer(3)
def update_relay(num):
    import thermostat
    actual = float(thermostat.read_sensor(0x48)) * 1.8 + 32.0
    target = float(thermostat.get_target_temp('/var/www/public/static/basic.ics', 'America/New_York'))
    print("Measured temperature: %f degrees. Target is %f degrees." % (actual, target))
    if actual < target:
        pytronics.digitalWrite(2, 'HIGH')
        print("Heat on")
    else:
        pytronics.digitalWrite(2, 'LOW')
        print("Heat off")
The basic flow of the function is to check the sensor, then get the current target temperature. If the temperature is too low, we heat; otherwise we don't. The address 0x48 is the default I2C address for the TMP102 sensor. The * 1.8 + 32.0 is a conversion from the sensor's native Celsius to the inferior Fahrenheit scale my American upbringing burdened me with. There's also some tricky business going on with the arguments to get_target_temp, but let's look at the guts of the read_sensor function in more detail first. I've put the code that is specific to the thermostat in a separate file, thermostat.py. That's where the function below comes from.
def read_sensor(address):
    import pytronics
    try:
        data = pytronics.i2cRead(address, size = 'W')
    except:
        print 'Couldn\'t get reading from sensor'
        return 0.0
    return ((data % 0x0100 * 16) + (data / 0x1000)) * 0.0625
This code uses the Rascal's Pytronics library to talk to the sensor. The sensor returns the data in a funny format, so the last line converts it to a (Celsius) decimal string like 25.0.
Figuring out the target temperature
Now let's look at the code to figure out the target temperature. First, let's assume that we've set up a Google calendar with some sensible events that recur weekly. For each event, the calendar field called "summary" is the target temperature for the duration of the event. If there is no event happening, the thermostat will fall back to its default value. I have the calendar set up so that the events are during the day. At night, the thermostat falls back to my default of 56.0 degrees. The image below shows what my calendar looks like.
We want to query the calendar every so often to see what temperature we should be aiming at. For this, we have the Python code below from server.py, which grabs a new copy of the Google calendar every 300 seconds (5 minutes) using the urllib library, which is part of the Python standard library.
@rbtimer(300)
def fetch_calendar(num):
    import thermostat, urllib
    urllib.urlretrieve(CALENDAR_URL, LOCAL_CALENDAR)
Parsing the calendar file would be really ugly, but because people use Python for all sorts of weird stuff, an open source iCalendar Python library already exists for parsing the .ics files used by Google Calendar. We called get_target_temp() and passed it two strings: '/var/www/public/static/basic.ics' and 'America/New_York'.
def get_target_temp(calendar_path, timezone_name):
    import datetime, icalendar, pytz
    f = open(TARGET_PATH, 'r')
    override = f.read()
    if (override[0:5] != 'abort'):
        return str(override)
    days = list(['MO', 'TU', 'WE', 'TH', 'FR', 'SA', 'SU'])
    now = datetime.datetime.now(pytz.timezone(timezone_name))
    today = days[now.weekday()]
    events = icalendar.Calendar.from_string(open(calendar_path,'rb').read().walk('VEVENT')
    for event in events:
        if event_is_today(event, today) and event_is_now(event, now):
            return float(event.decoded('summary'))
    return DEFAULT_TEMPERATURE
The interface
The target temperature is controlled through the aforementioned calendar, so all the web interface has to do is show us a nice graph. We start by adding a div like the one below to a new page on the Rascal.
<div id="chart1" style="height:500px;width:900px;"></div>
Then, we use jQplot, a Javascript library that is a jQuery plugin, to turn the div into a graph. The first part of the script sets up all the jQplot options. You can read more details about how jQplot options work in the jQplot API documentation.
chartOptions = {
    legend: {
        show: true,
        location: "se" },
    title: "Channel 0",
    series: [
        {label: "Actual temperature", lineWidth:3, showMarker:false},
        {label: "Target temperature", lineWidth:3, showMarker:false},
        {label: "Heater status", lineWidth:3, showMarker:false, fill: "true", fillAlpha: 0.5}
    ],
    axes: {
        xaxis: {
            label: "Time [seconds ago]",
            min: 0,
            max: 300,
            pad: 0 },
        yaxis: {
            label: "Temperature [F]",
            min: 60.0,
            max: 95.0 },
    },
    seriesColors: [ "#414243", "#08C239", "#CD2820" ]
};
Here's what the graph looks like in action.

We want to update the graph dynamically, so we set a Javascript timer to ask the Rascal for a new datapoint every 1000 ms (1 second). We keep three arrays of readings: the current temperature, the target temperature, and whether the heat is on or off. Each time the function is executed, we fetch new temperatures and add them to our arrays. If we've reached the full width of the chart, we start discarding old data.
a0 = new Array();
a1 = new Array();
a2 = new Array();
firstTime = true;
var plot1;
setInterval(function() {
    $.post("/temperature", function(response) {
        data = $.parseJSON(response);
        var i;
        if(a0.length > chartOptions.axes.xaxis.max) {
            a0.pop();
            a1.pop();
            a2.pop();
        }
        actual = data.actual * 1.8 + 32.0
        threshold = data.target
        a0.unshift([0, actual]);
        a1.unshift([0, threshold]);
        if (actual < threshold) {
            a2.unshift([0, actual]);
        } else {
            a2.unshift([0, 0.0]);
        }
        // Adjust old X values
        for (i = 1; i < a0.length; i++) {
            a0[i][0] = i;
            a1[i][0] = i;
            a2[i][0] = i;
        }
        if (firstTime) {
            plot1 = $.jqplot("chart1", [a0, a1, a2], chartOptions);
            firstTime = false;
        } else {
            plot1.series[0].data = a0;
            plot1.series\[1\].data = a1;
            plot1.series\[2\].data = a2;
            plot1.replot();
        }
    });
}, 1000);
On the Rascal side, the code that retrieves the temperature is the same as what's used in the update_relay() function, but we skip updating the relay because we don't want the boiler to get toggled too often. (This would be especially bad if several people loaded up the chart on different computers simultaneously.)
@public.route('/temperature', methods=['POST'])
def temperature():
    import json, thermostat
    data = {
        "time" : float(time.time()),
        "actual" : float(thermostat.read_sensor(0x48)),
        "target" : thermostat.get_target_temp('/var/www/public/static/basic.ics', 'America/New_York')
    }
    return json.dumps(data)
Wait, what about the text message override?
Twilio is a web service that will convert text messages to standard POST requests. I have a Twilio account set up to forward text messages to a certain phone number to a port on my Rascal. The first 3000 messages are free; they cost $0.01 after that.
When Twilio receives a text message to my number, one of their servers makes an HTTP POST request to the address that I specified in the Twilio dashboard in the SMS URL field. (Take a look at the Twilio SMS documentation for more details.)
The Rascal is set up to respond to such requests with a short bit of code that just writes the contents of the text message to the thermostat target file. Once the new target temperature is written, the regular cycle takes over and toggles the relay as needed. The text message override continues until I text the word "abort" to the Rascal; that returns control to the Google calendar as described earlier.
@public.route('/parse_sms', methods=['POST'])
def parse_sms():
    message = request.form['Body']
    print "Received text message: " + str(message)
    f = open('/var/www/public/thermostat-target.txt', 'w')
    f.write(str(message))
    f.close()
    return ('Message processed')
Want to build this?
All of the code used in this tutorial ships on the Rascal by default. The timed events are commented out to disable them, but you can reenable them if you like. You should probably go buy a Rascal in the store right away.